Apollo is an analytical platform used to provide near real-time information to the technical support team. Build by me in Python and React.
The implementation of this project marked a turning point in the team’s performance and removed a lot of stress and questions from the day to day activities.
This project may not be complex in the sense that it does not use ML or AI behind the scenes, but it shows the power of good data that results from a proper treatment workflow.
Technologies / techniques used
- Python with FastAPI framework and Pandas packages (mostly)
- HTML / Javascript (React)
- memcached
- SQL
- Docker
Description
One of the biggest challenges when handling a team and it’s operations is having an up to date report on what’s going on. Whether good or bad, a manager and his team needs to have clear numbers on their activity. There’s nothing worse than to receive a reminder at the eleventh hour that something needs to be fixed or delivered. What follows up in this case is the dispatch in an urgent matter of ressources, possibly stopping certain operations thus encountering further delays, and impacting the image of your service, generating in this manner a vicious circle.
This was exactly the situation with one of my clients.
In order to break from this situation, an analytical platform was needed that could fetch the data from the client’s ITSM and analyze and structure the data in order to gain visibility on the activity. Unfortunately, the budget for this type of requirements was 0, so I built my own.
Solution
Architecture
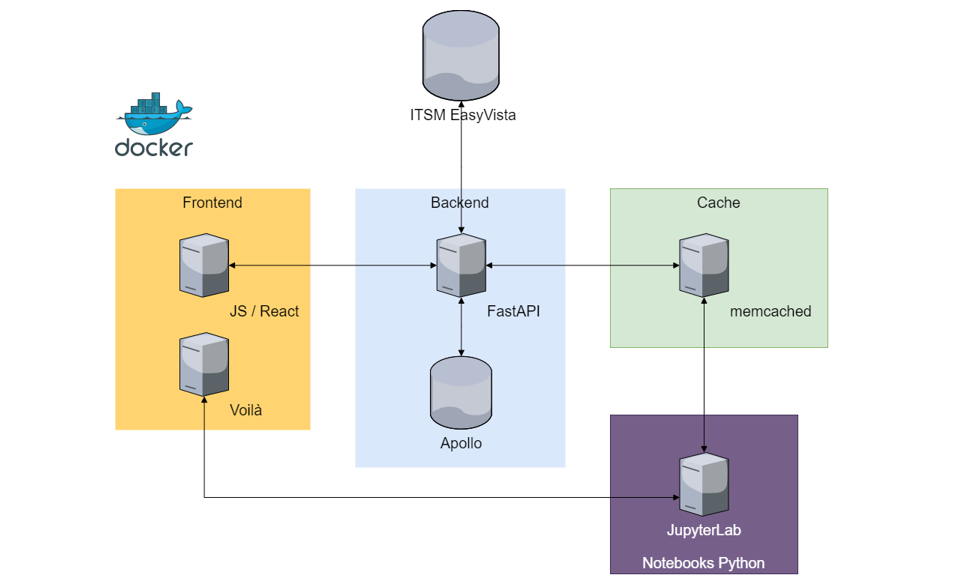
Apollo was developed during 6 months and it has 4 main components:
- Frontend
- Backend
- Cache (memcached)
- Advanced reports (Notebooks Python)
A prototype was made as well with Prefect and Dask to parallelize data analysis workflows, but it was stopped as it was overpowered for the scope of the project. Nevertheless, it provided some valuable insight in this areas.
The Frontend was developed with HTML and Javascript, the components of the interface were created using React. The main components are:
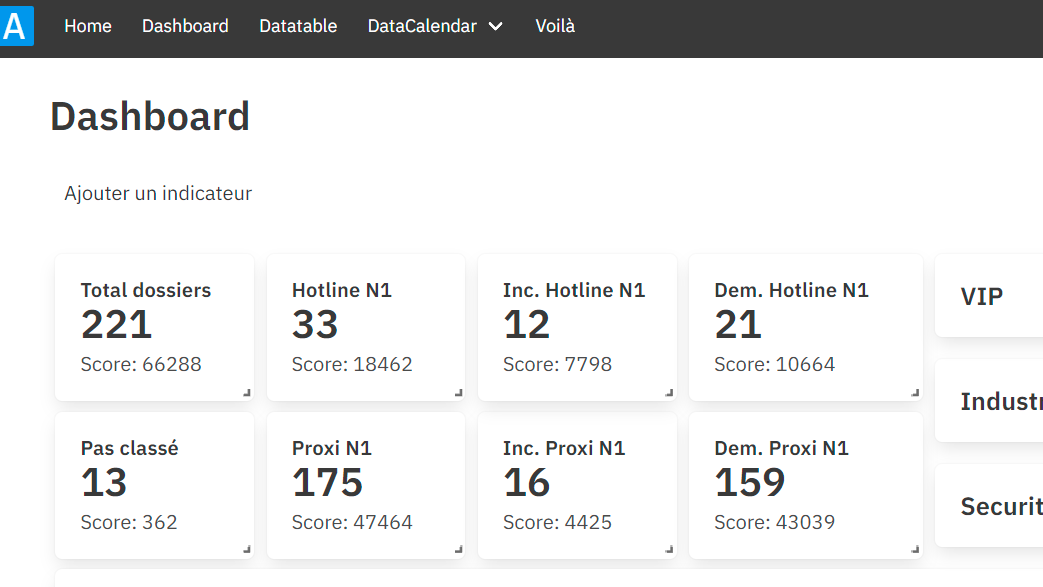
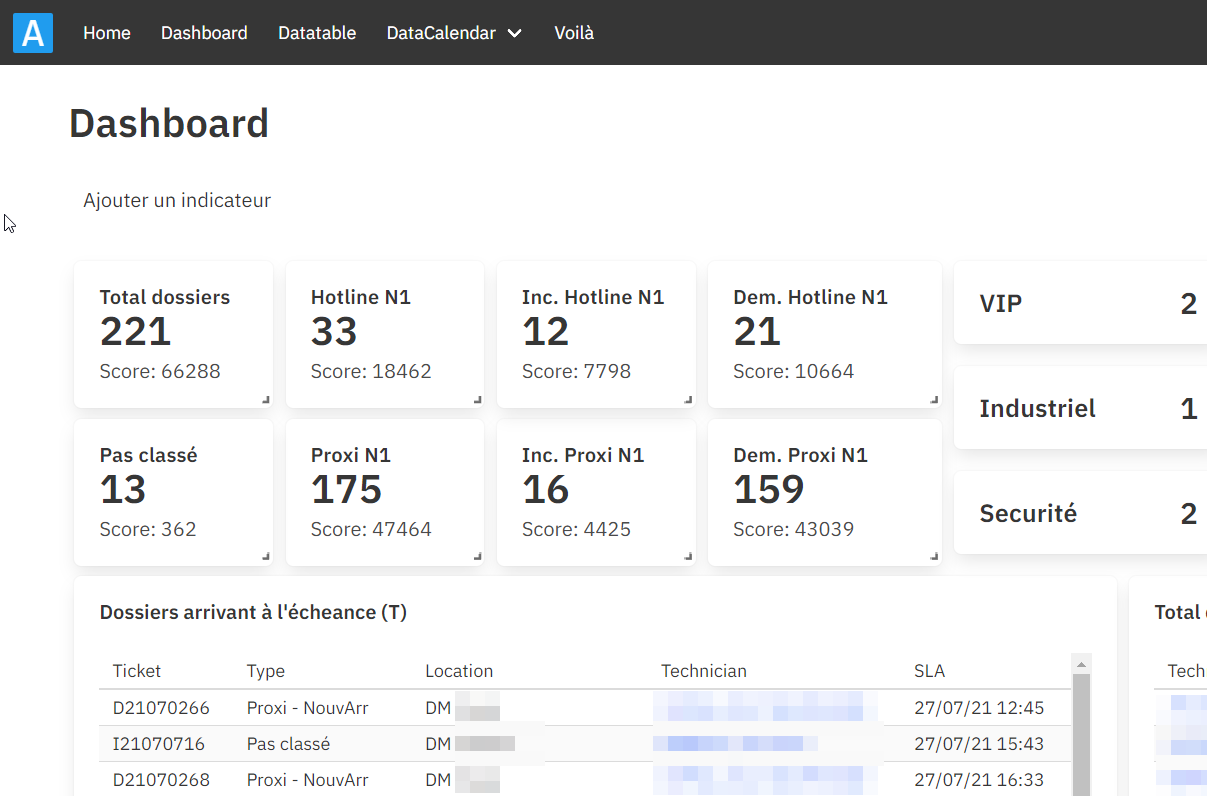
- KPI cards for 41 indicators
- key performance tables
- datatables
- datacalendars
The Backend had 2 components:
- the API: for calls
- the analytical engine: the backbone of the application, contained the functions and workflow definitions for the KPI calculation
The Cache was used in tandem with the backend to serve the already calculated KPI, if they were still valid.
The Advanced reports was actually a Jupyter Lab server that was used for:
- non-realtime reoccuring reports
- prototyping new reports
- one-of-a-kind analysis
Backend analysis
The data analysis was done using SQL and Python (pandas, plotly and altair modules).
The end to end analysis of KPI respected a classical approach.
- Data was requested through SQL from the client’s ITSM DB
- The raw data was cleaned and new variables were calculated
- an analysis was run depending on the selected KPI
- the result was packaged and sent to the frontend
To prevent code repetition, the analysis pipeline was structured into workflows which were composed of single pure functions. In this way, an analysis function could be used in different workflows.
Frontend Components
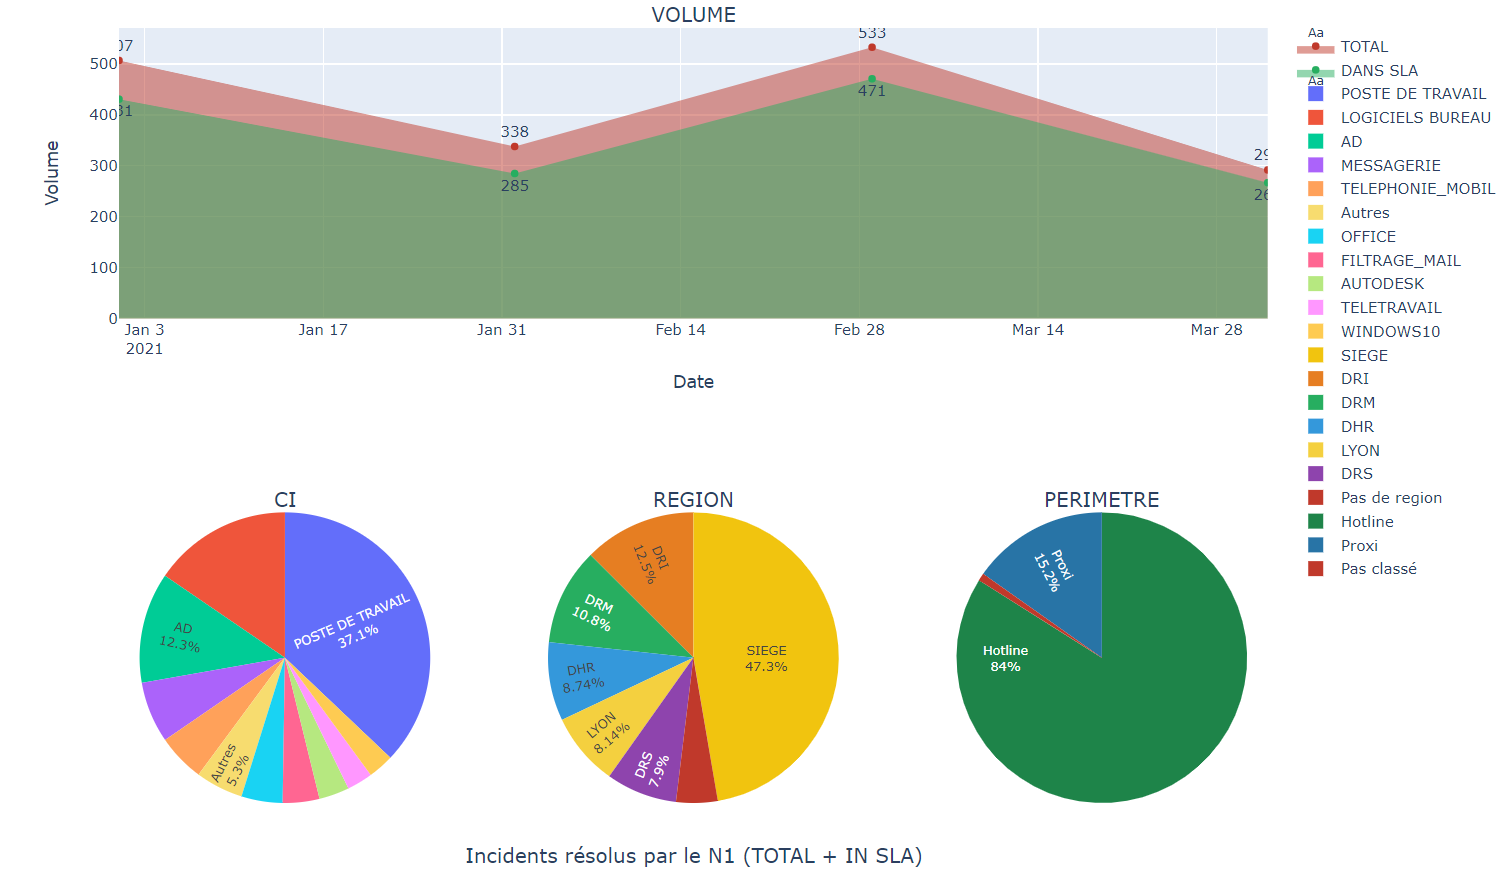
Dashboard
The dashboard is the landing page of the application and it’s used to show at a glance all the selected indicators. The dashboard could be customized, meaning that some cards could be deleted from it, in order to create a customizable experience.
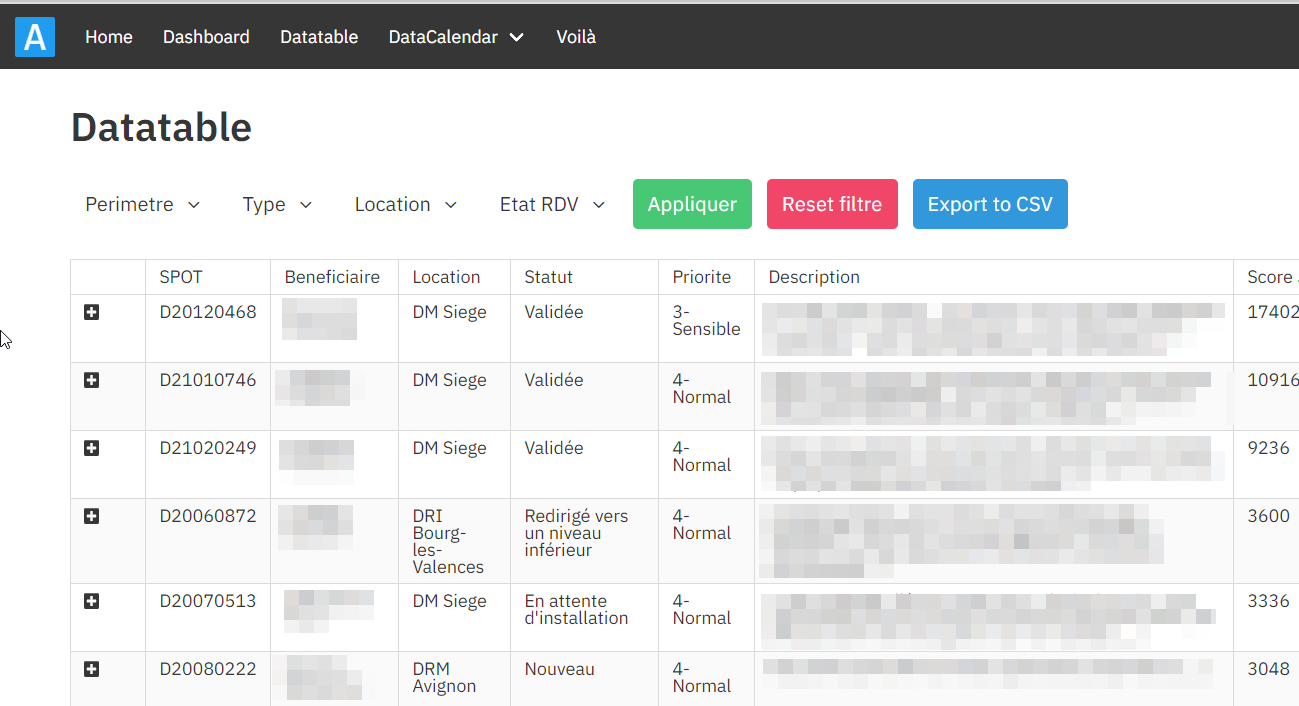
Datatable
In order to provide the users with certain filtering features, I created a datatable which had the following features:
- filtering
- export to CSV
- classification options
- detail expansion
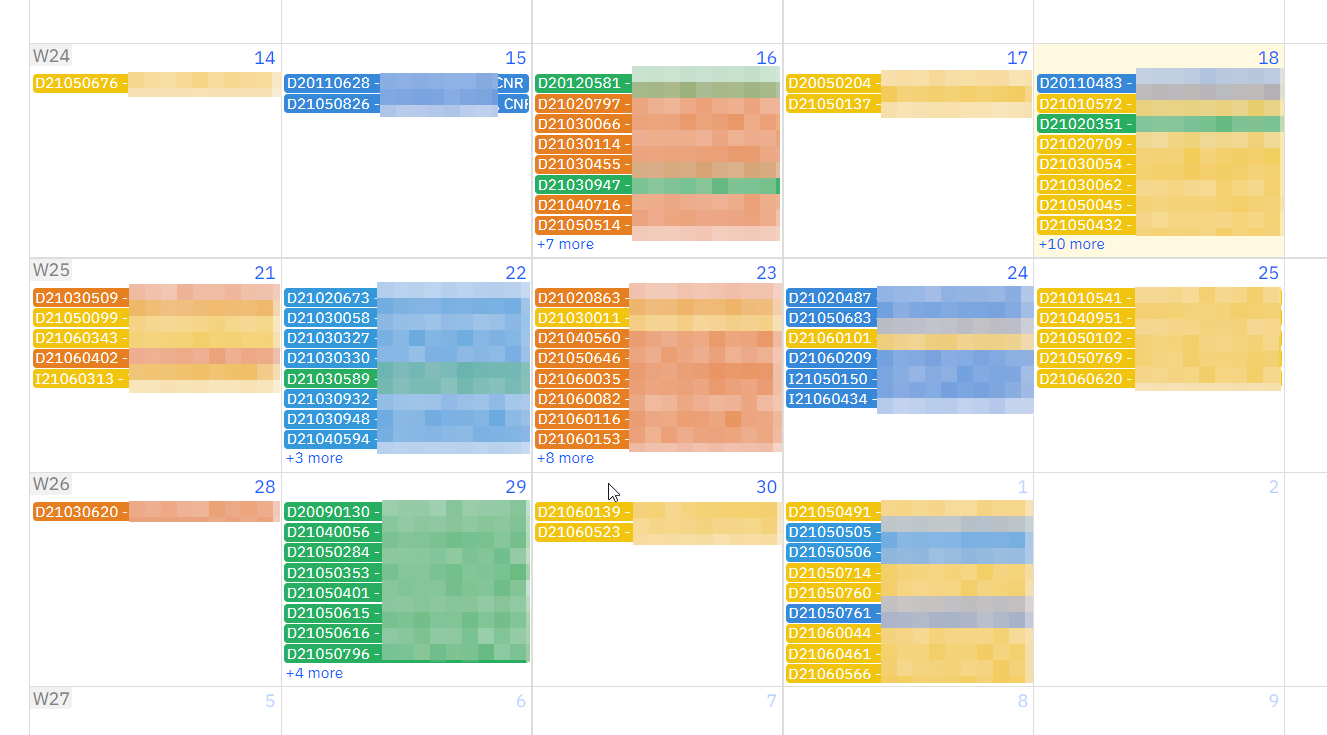
Intervention Schedule
Having a list of things to do is nice, but if they’re timebound, it would be nice to show them when exactly they will occur. The Datacalendar does just that, it shows the interventions by date of delivery, colored by location with detailed information to identify them at at glance.
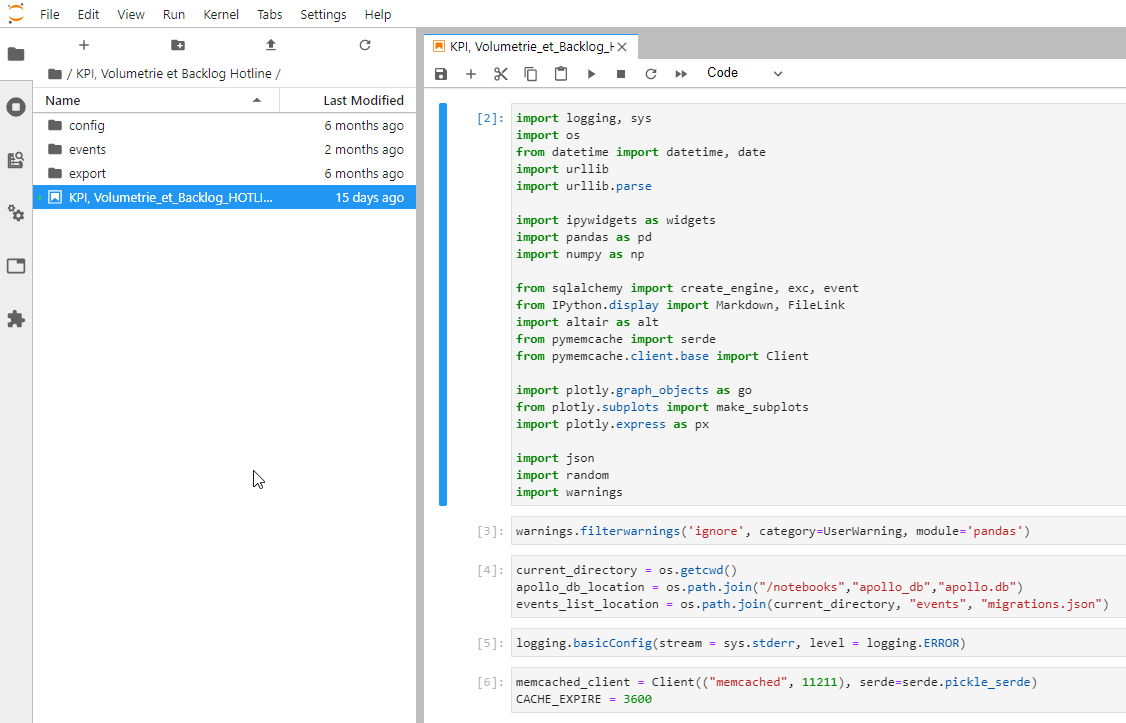
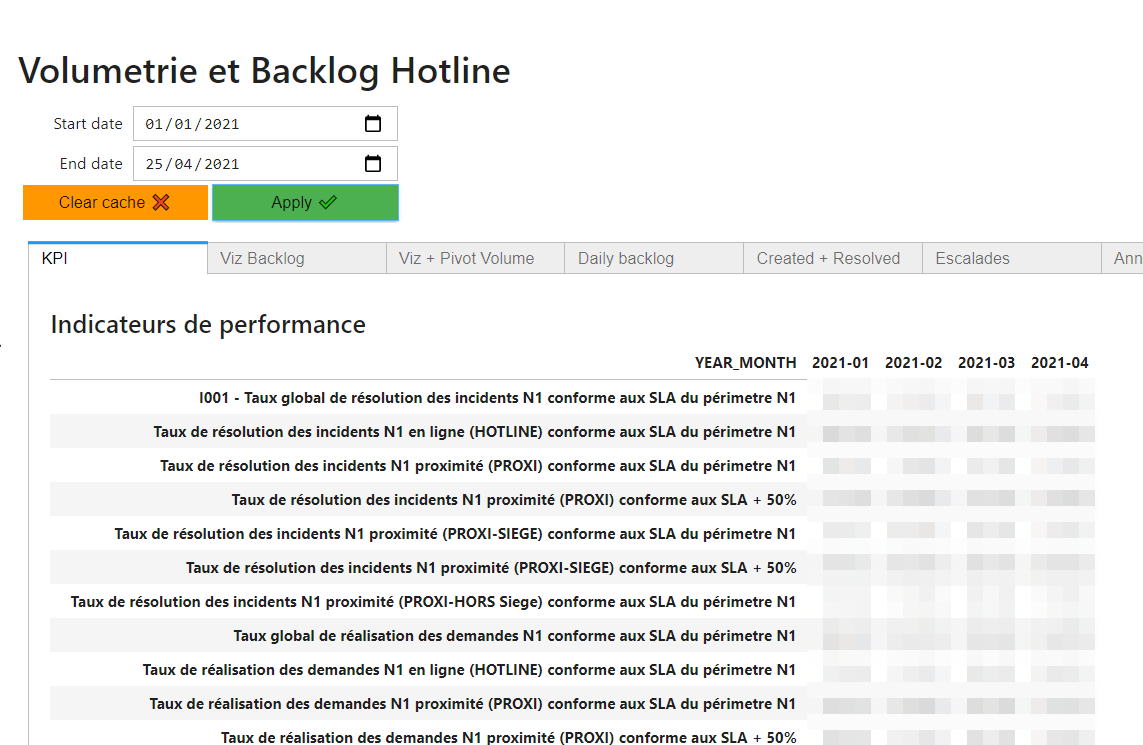
Jupyterlab report
Having realtime KPI is nice, but what about if you need hystorical analyzed data. For this need, a separate component was implemented, a JupyterLab server in order to perform analyses on notebooks.
KPI history
Sankey diagram
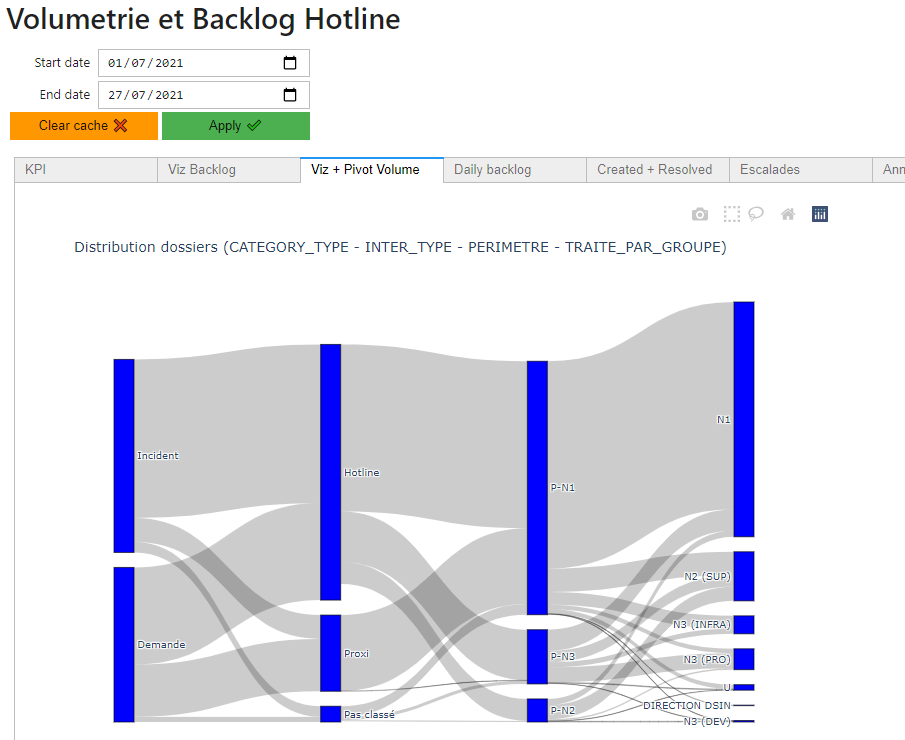
Data visualisation
Example of a notebook in JupyterLab